Part 1: Buisness Part
Gain insight into customers’ visit pattern and review.
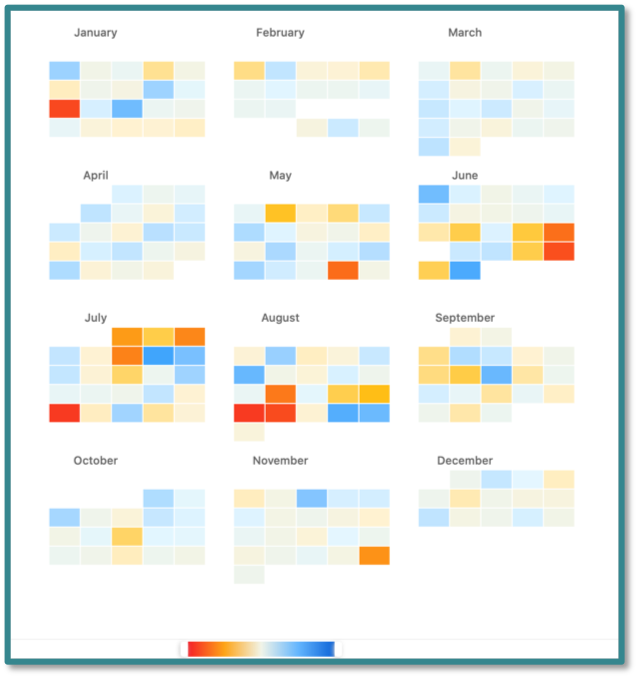
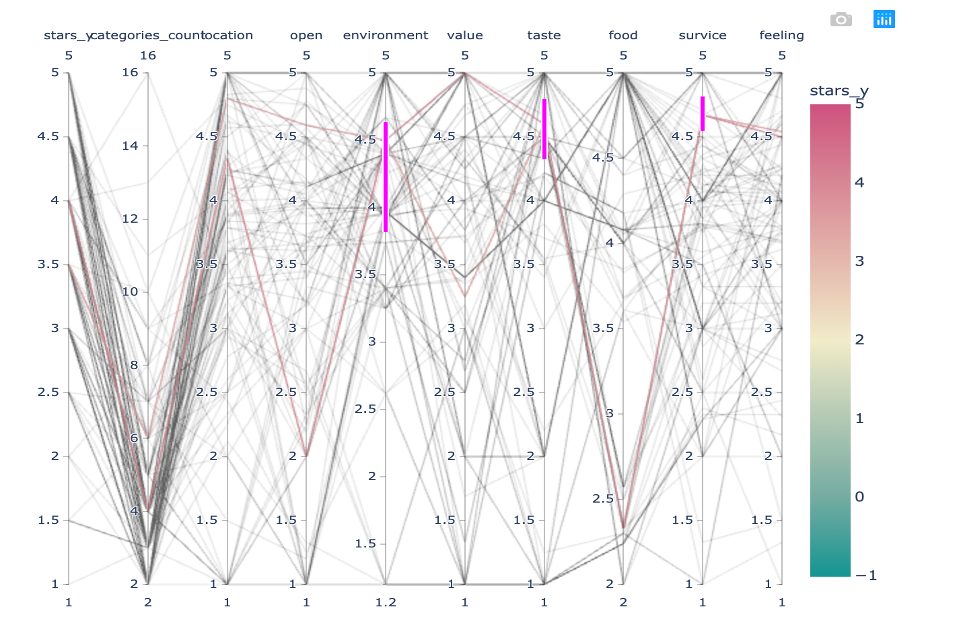
We designed different visualization tools for the user and the business. For the business, we built a heat map to monitor the flow of passengers, and built a review river to see the store. For users, we constructed maps and parallel coordinates to help users make rough choices, and constructed positive and negative word clouds and radar charts to help users compare in detail.
Gain insight into customers’ visit pattern and review.
In this part, we help user to search the restaurants as user-oriented criteria.
HKUST Msc. BDT & IT

HKUST Msc. BDT
yliiz at connect.ust.hk

HKUST Msc. BDT
HKUST Msc. BDT

HKUST Msc. IT